Oct 30 - Nov 13 · Week Seven · Studio Practices
The UX of Radio Waves
Revati Banerji I MA UX Design I London College of Communication
Brief: Design an embodied experience of radio waves
Team: Oindrilla Sinha · Sakshi Pansares · Aishwarya Saji · Evander Wang · Vibhooti Sharma · Lynn Zhong
“I do not think that the radio waves I have discovered will have any practical application.”
— Heinrich Hertz
Unfortunately for Hertz, he could not have known that radio waves would go on to power everything from communication to navigation systems, shaping how we experience the world today. Admittedly, my team and I knew very little about radio waves at the start of the week and spent much of our time understanding what they are and how they behave.
We then conducted an AEIOU observation of the classroom. Almost everyone was on laptops or phones, using AirPods, switching between multiple tabs, browsing, texting, watching videos, or researching in parallel. Devices were constantly charging, connecting to Wi-Fi or Bluetooth and being used both individually and in groups. If stacked together, the devices in use could form a miniature version of the radio installation we saw earlier.
AEIOU
3:15 PM · 4.11.2025
Following this, we asked: what if radio waves were considered a form of pollution? Invisible, excessive and constantly circulating unchecked. We then considered how this pollution might be physicalised, proposing it as Direction One during our tutorial.
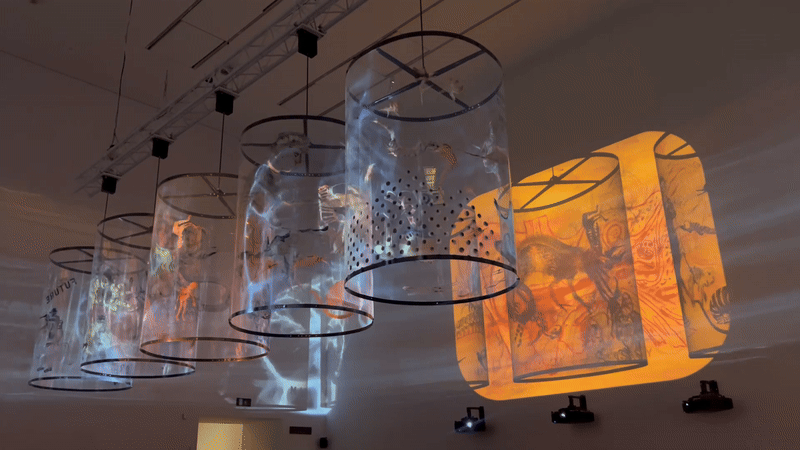
We visited Tate Modern and saw a towering installation made from stacked radios, each tuned to a different station and playing simultaneously. The overlapping broadcasts merged into incoherence and overwhelm. In contrast, the second video-based shadow installation we encountered felt calmer and more meditative, despite being larger and more immersive.

Fig. 2. References exploring sensory takeover through sound and projection: (left) Babel 2001, Cildo Meireles · (bottom right) In Search of Vanished Blood by Nalini Malani.
Research
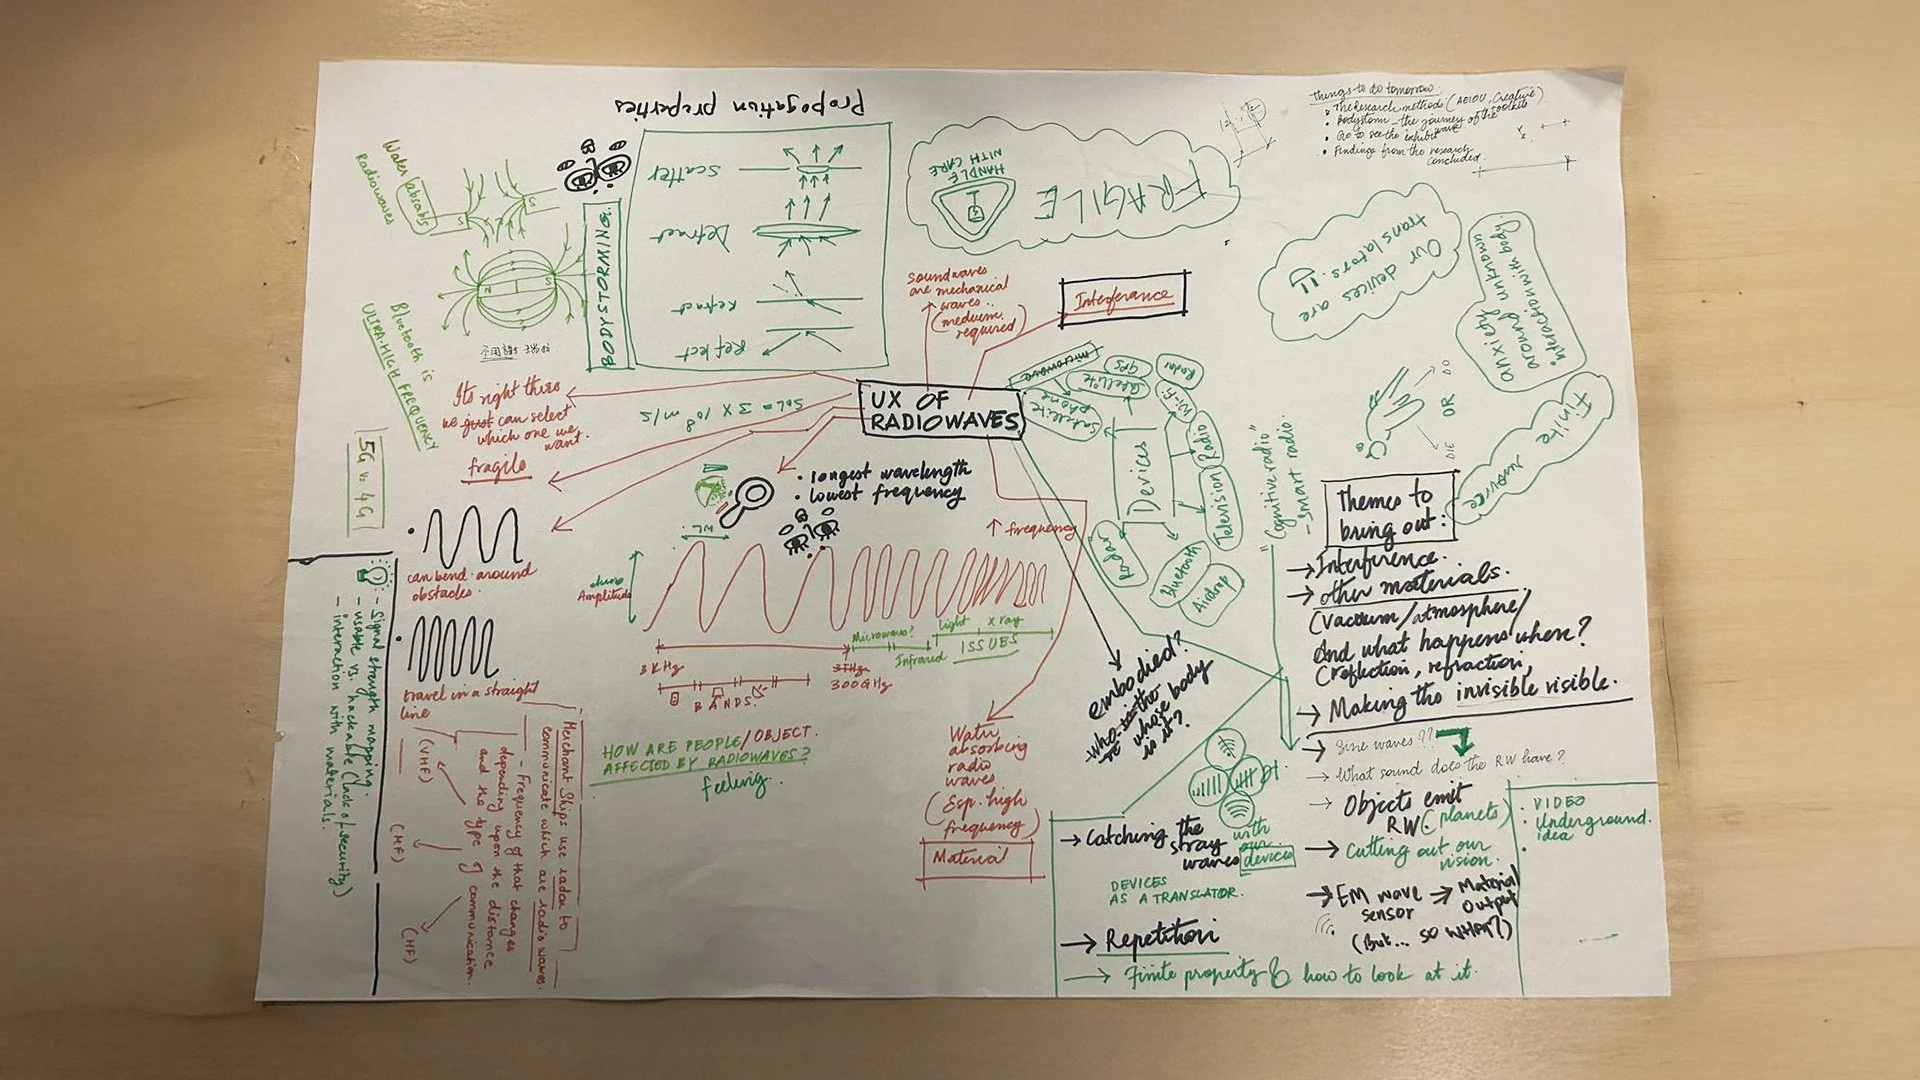
Fig. 1. Early mind map exploring radio waves.
For Direction Two, we looked to Michael Faraday, who was born close to our campus. His invention of the Faraday cage, a structure that blocks electromagnetic signals, prompted a comparison between intensive data usage in our classroom and the underground station across the street.
The Tube functions almost like a Faraday cage, where connectivity drops or disappears altogether. We wished to examine how behaviour shifts when connectivity is reduced, how people respond when signal is weak and which apps are prioritised when connectivity returns.
-
On laptops / phones / iPads / AirPods / keyboard (mostly Apple products; also Samsung, Lenovo, Apple Pen)
• Automatically connect to Wi-Fi
• Charging phones / laptops
• Bluetooth to connect to seats
• Recording
• AI browsing
• Texting
• Watching videos
• Translating
• Note-taking
• Designing
• On browser, on specific apps, for duration of a class
• In groups, with friends, individually, with others outside the room (texting) -
• Inside classroom
• Chatty, serious, casual, fun (smiling / laughing), busy, creative, concerned
• Collaborative, jovial, agreeable, factual
• Natural + artificial lighting -
• Interacting via devices (looking at wedding pictures 🙂)
• Eating / drinking
• Mostly gossiping
• Feedback session in groups (less relaxed than the rest)
• Conversations about work and other topics as well
• Mostly in their own groups, but some moved around
• At 3:20 PM → some got up and left (group of 6)
• At 3:22 PM → wave bye 👋
• Talking loudly with someone across the room
• Yawning / sleeping / standing (1 person) / sitting (everyone else)
• 3:33 PM → device usage reduced → conversations more (everyone is almost leaving)
• Sitting on chairs
• Dressing up to leave, bracing cold outside
• Assuming teacher isn’t watching their phone use
• 3:35 PM → 2 more people left (looks ~40% fewer people) -
• Water bottles, coffee cups, lots of art materials (pens / papers, etc.)
• Student IDs
• More chairs than people
• Chargers, windows -
• Students
• Designers
• Instructor (1)
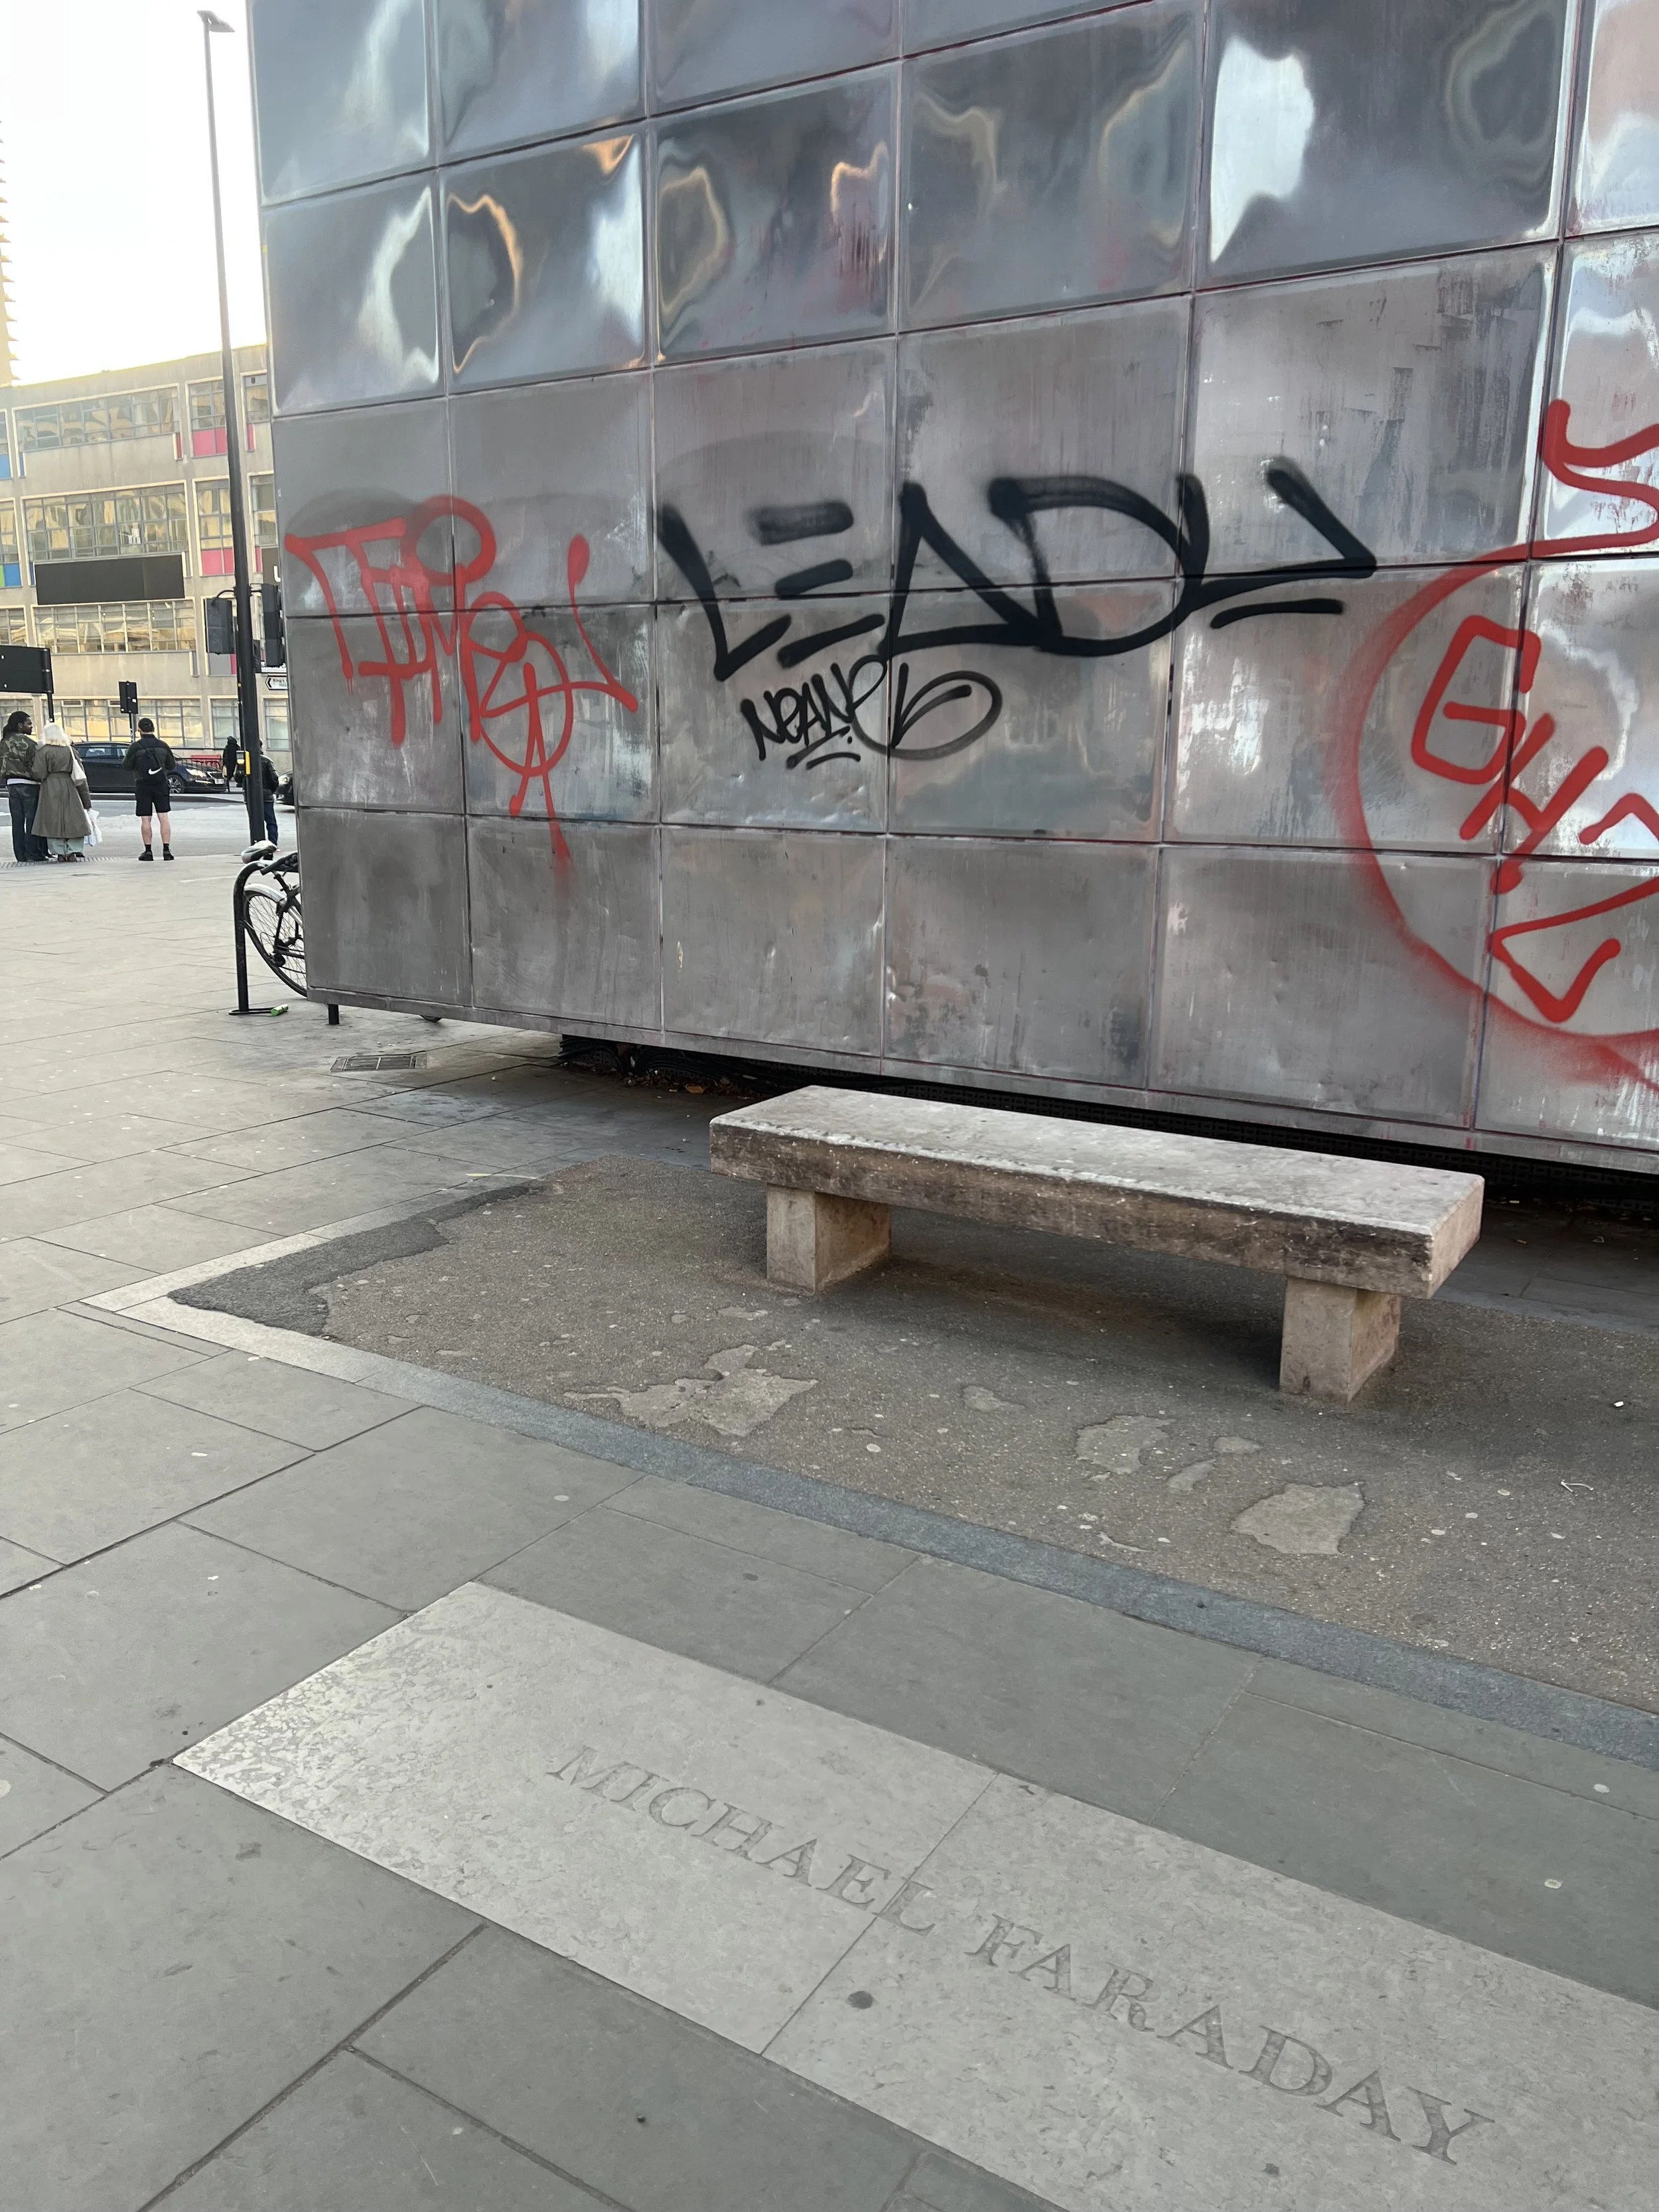
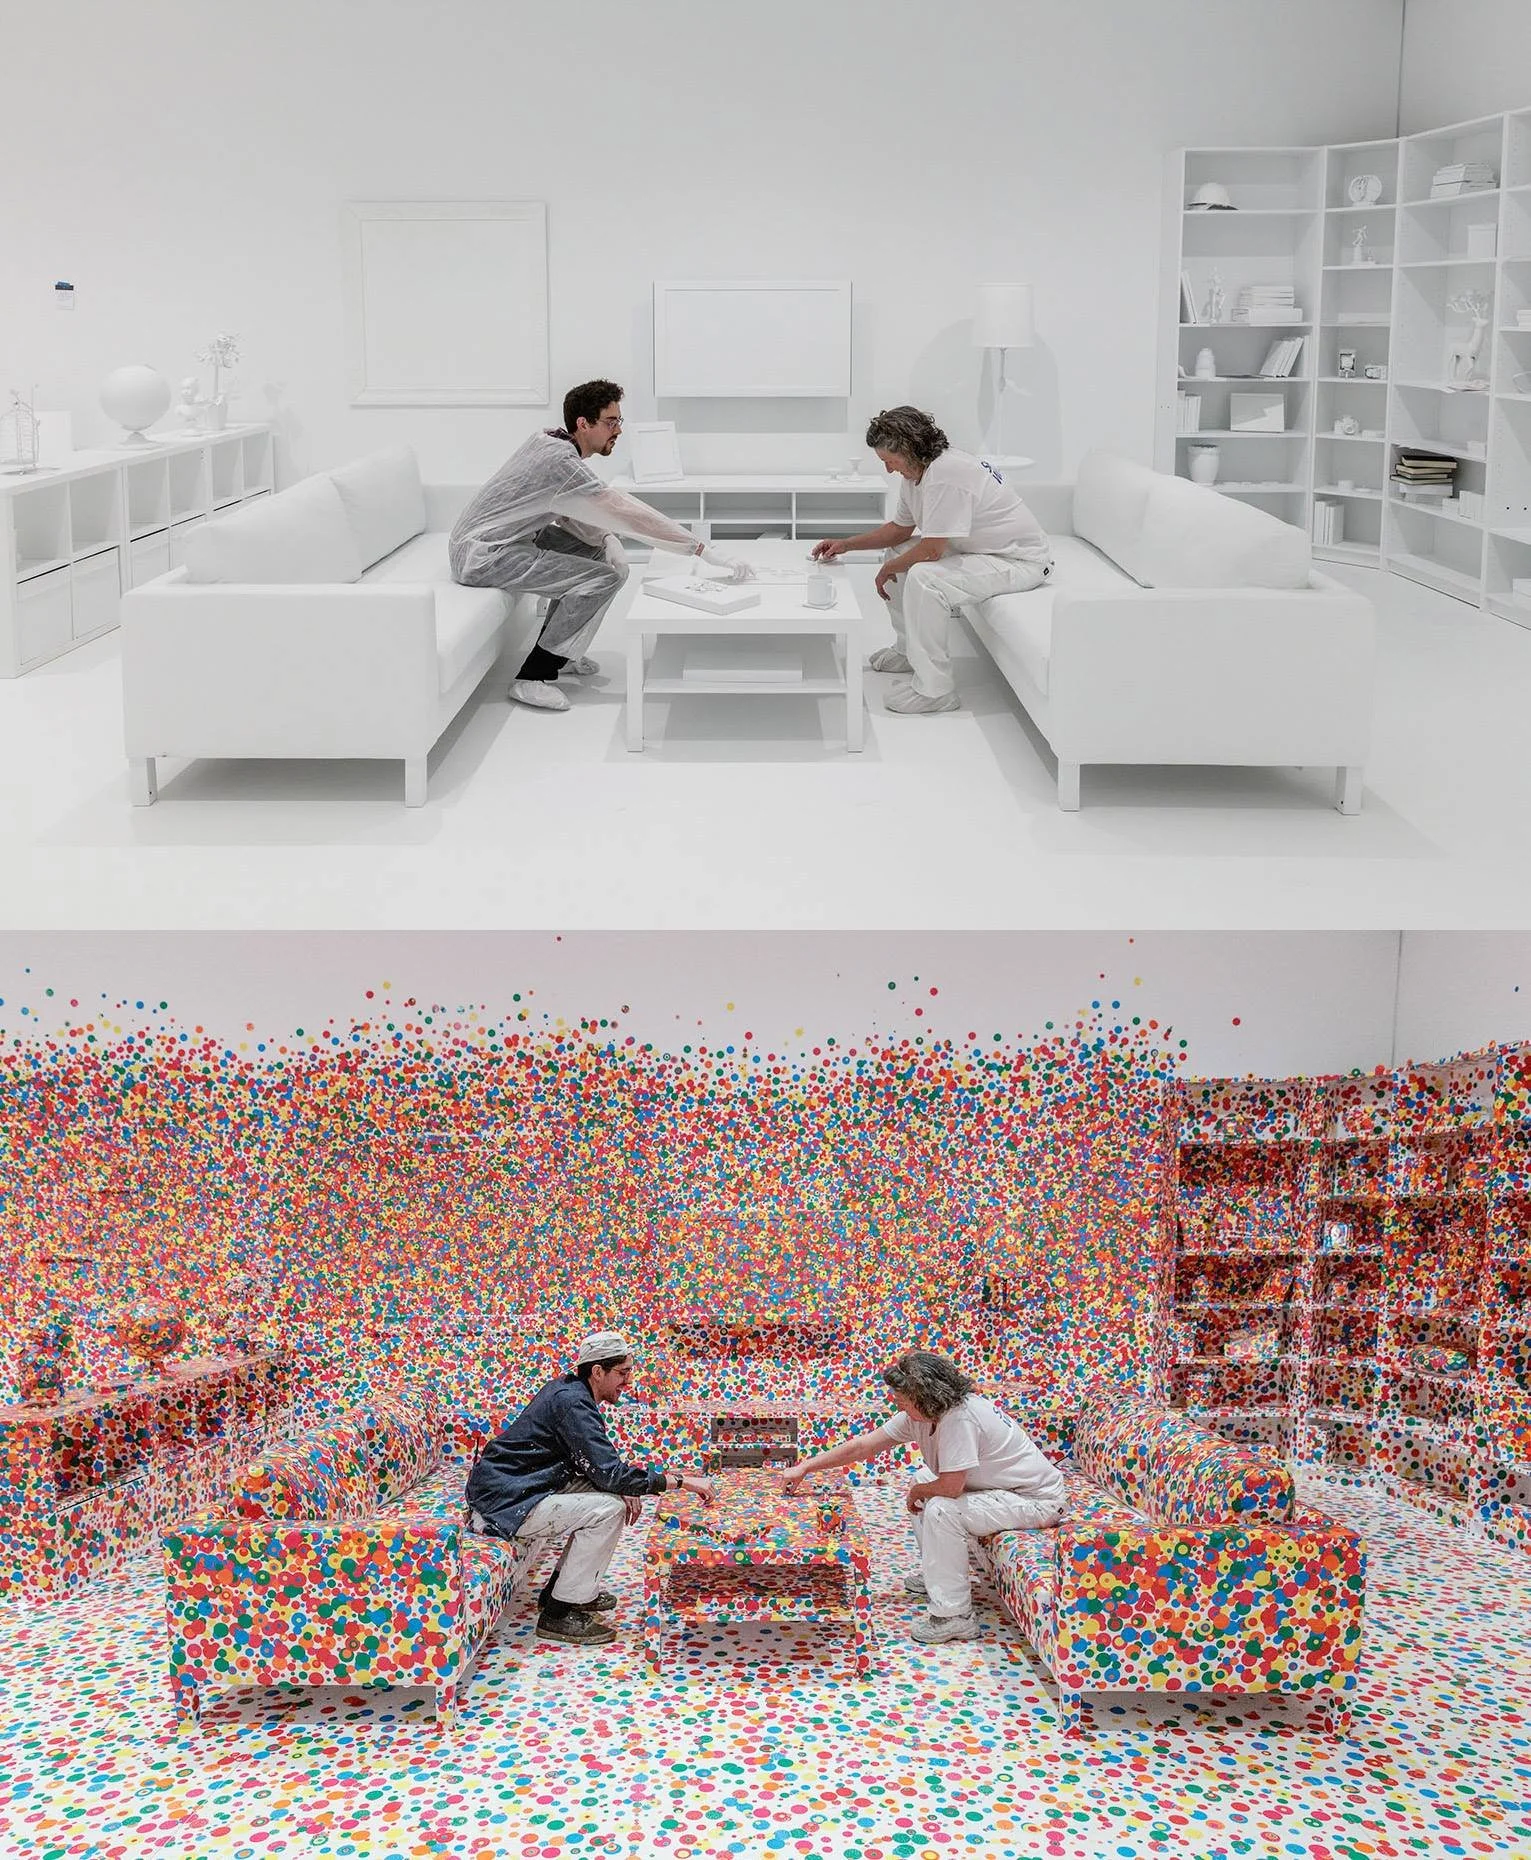
Fig. 3. References exploring making the invisible visible through materials: (left) Urs Fischer · (middle) Yayoi Kusama · (right) Samuel Stubblefield
Our feedback warned us that our experience risked becoming a data visualisation rather than an embodied experience. We were encouraged to think about how people might feel radio waves. This led us to ideas of the visceral and embodied as discussed in Data Feminism (D’Ignazio and Klein, 2020). A visceral experience is less about translating data into visual form and more about sensing and feeling scale, intensity and impact.
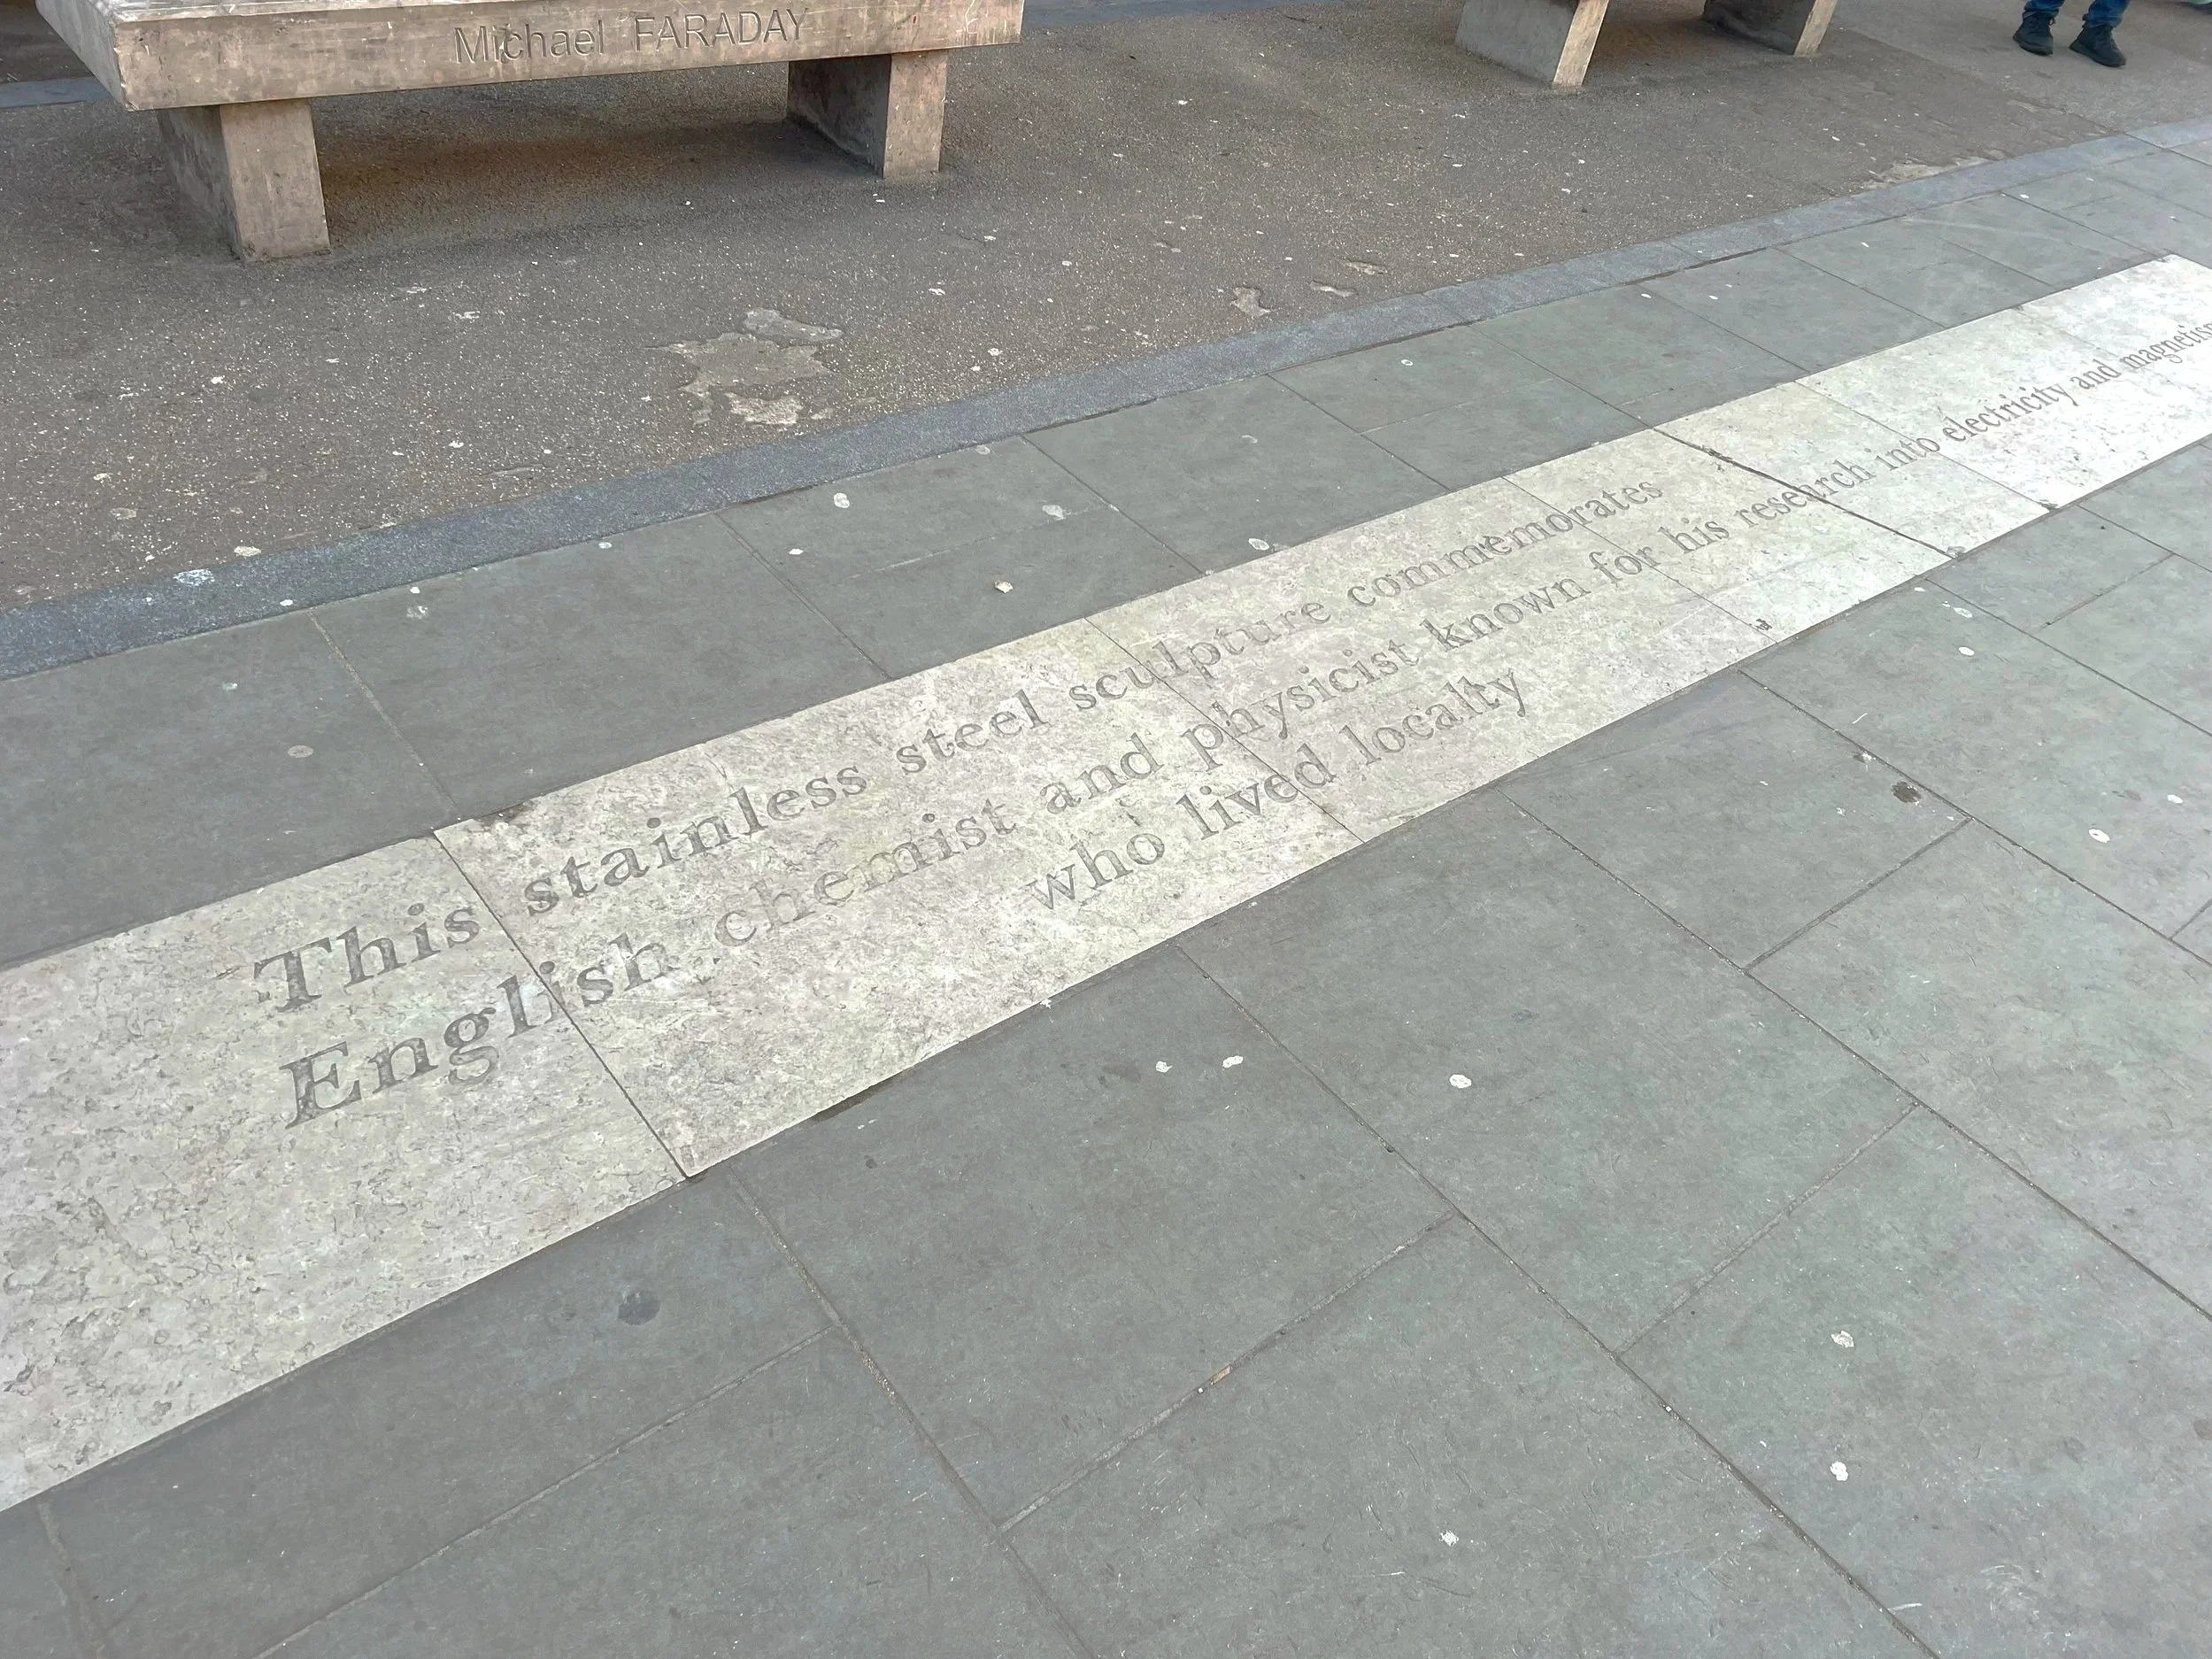
Fig. 4. Michael Faraday memorial outside Elephant and Castle Underground Station. Photography by author.
References:
Tate (2013). ‘Babel’, Cildo Meireles, 2001 | Tate. [online] Tate.
Available at: https://www.tate.org.uk/art/artworks/meireles-babel-t14041
(Accessed: 15 January 2026).
Tate (n.d.) Nalini Malani: In Search of Vanished Blood. Available at: https://www.tate.org.uk/art/artists/nalini-malani-14670/understanding-in-search-of-vanished-blood
(Accessed: 15 January 2026).
Fischer, U. (n.d.) Urs Fischer x Katy Perry: Bliss. Available at: https://ursfischer.com/exhibitions/Urs%20Fischer%20x%20Katy%20Perry%3A%20Bliss
(Accessed: 15 January 2026).
Tate (n.d.) Yayoi Kusama’s Obliteration Room. Available at: https://www.tate.org.uk/art/artists/yayoi-kusama-8094/yayoi-kusamas-obliteration-room (Accessed: 15 January 2026).
Stubblefield, S. (n.d.) Bungees installation. Available at: https://www.samuelstubblefield.com/bungee-installation
(Accessed: 15 January 2026).